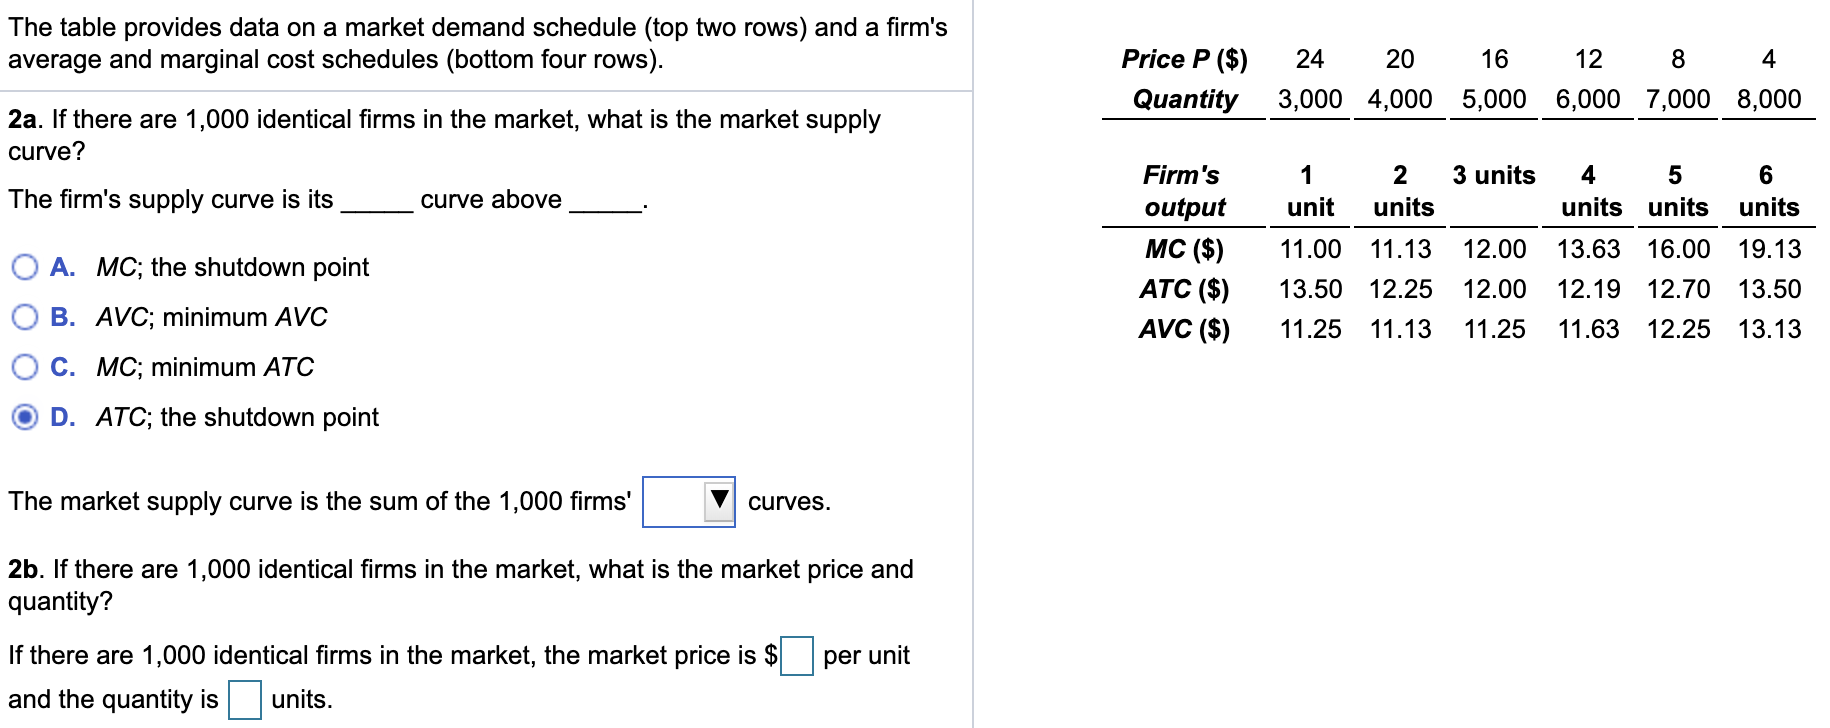
The table provides data on a market demand schedule (top two rows) and a firm’s average and marginal cost schedules (bottom four rows). Price P ($) Quantity 24 20 16 12 8 4 3,000 4,000 5,000 6,000 7,000 8,000 2a. If there are 1,000 identical firms in the market, what is the market supply curve? The firm’s supply curve is its_ curve above_ . 3 units 4 5 units units 6 units O A. MC; the shutdown point OB. AVC; minimum AVC OC. MC; minimum ATC OD. ATC; the shutdown point Firm’s output MC($) ATC ($) AVC($) 1 unit 11.00 13.50 11.25 2 units 11.13 12.25 11.13 12.00 12.00 11.25 13.63 16.00 12.19 12.70 11.63 12.25 19.13 13.50 13.13 The market supply curve is the sum of the 1,000 firms’ curves. 2b. If there are 1,000 identical firms in the market, what is the market price and quantity? If there are 1,000 identical firms in the market, the market price is $ per unit and the quantity is units.
"Looking for a Similar Assignment? Get Expert Help at an Amazing Discount!"